
Temperature-driven changes in viral loads in the honey bee Apis mellifera.
Similarly to how humans fight an infection with a low grade fever, honey bees may employ thermoregulation to fight off pathogens. However, temperatures outside of the optimal brood range (28-34 °C) can cause irreversible biological and physiological damage. The same holds true for pathogens. Abrupt temperature fluctuations can influence pathogen survival and reproduction.
These concepts intrigued researchers Dalmon et al. to investigate temperature-driven changes in host/pathogen interactions. To test this relationship, levels of Varroa vectored Deformed Wing Virus (DWV) were measured in emerging bees. Bees were then subjected to temperature stress (15°C, 28°C, 34°C, 37°C, 40°C or 43°C). The goal of this experiment was to potentially isolate a temperature which would reduce levels of Deformed Wing Virus(DWV) without jeopardizing honey bee survival. Daily bee survival was recorded over a two-week period followed by genetic analysis to measure changes in DWV (Figure 1, 2). Results indicate that viral reduction is possible at elevated temperatures (43°C) but is not an adequate tool in disease management because it strongly lowers honeybee survival
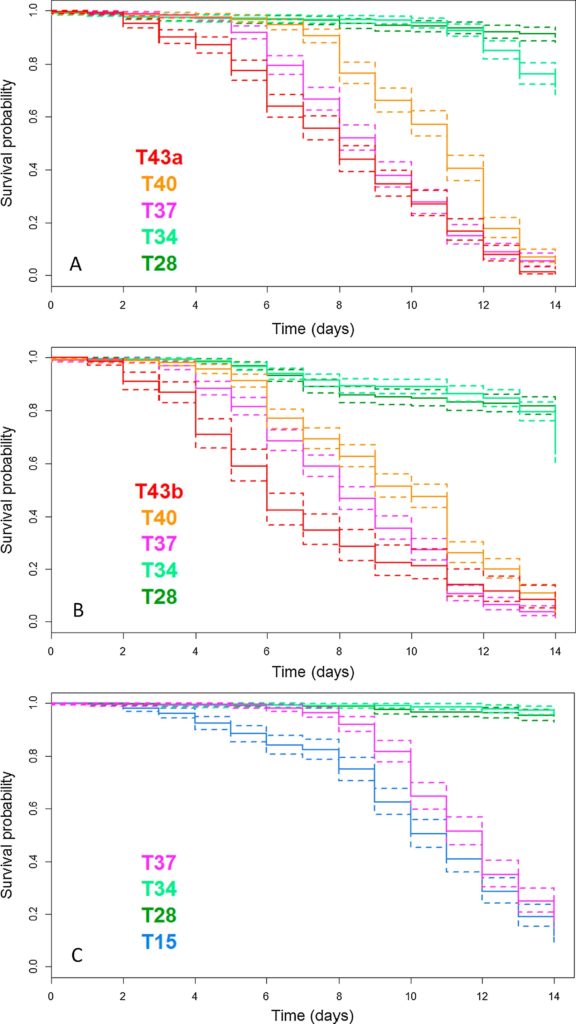
Figure 1. Survival probability for each temperature treatment.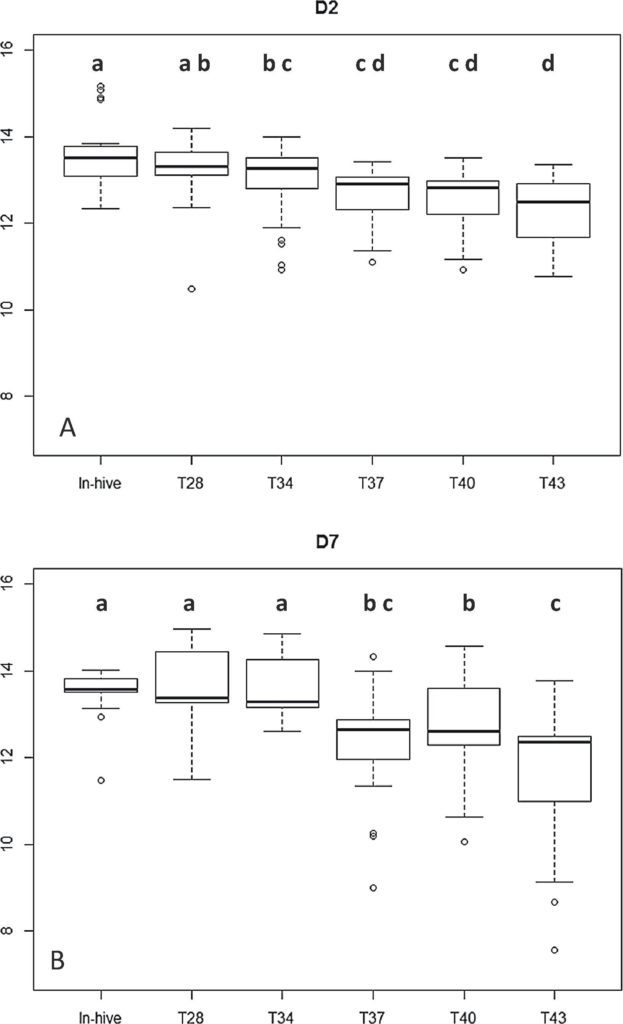
Figure 2. DWV loads after 2 (A) and 7 days (B). Black line indicates median DWV level. Circles represent outliers. Different letters (a, b, c, d) indicate significant differences between viral loads.
Measuring biological age to assess colony demographics in honeybees.
Environmental stress on honey bee colonies can cause colony disturbances that shift task allocation in adult workers. For example, a loss of foragers forces nurse bees to prematurely enter the forager workforce. Alaux et al. wanted to analyze colony disturbances indirectly by measuring the biological age of honey bees. To determine the biological age, biomarkers related to age-dependent division of labor were measured in addition to other colony parameters.
One important biomarker is vitellogenin(vg), a sugar-fat-protein (glycolipoprotein) conglomerate important for behavioral development, royal jelly production, and immunity. The other biomarker measured in this study is adipokinetic hormone receptor(akhr), a peptide hormone involved in hemolymph-sugar homeostasis and mobilization of sugars and fats during energy taxing activities such as flight. Foragers commonly have higher levels of akhr whereas nurse bees have higher levels of vg. These two biomarkers act in opposition and therefore have great potential to predict biological age.
To understand the evolution of biological age in bees, newly emerged bees were marked and reintroduced into host colonies. Samples of marked bees at ages 0 (newly-emerged), 2, 4, 7, 10, 13, 17, 21 and 24 days were removed from host colonies for genetic analysis of vg and akhr biomarkers. Figure 3 shows genetic expression of vg (circles) in honey bees increasing after emergence and remaining stable until day 10 as vg begins to deteriorate with age. Levels of ahkr (triangles) increased gradually with age.
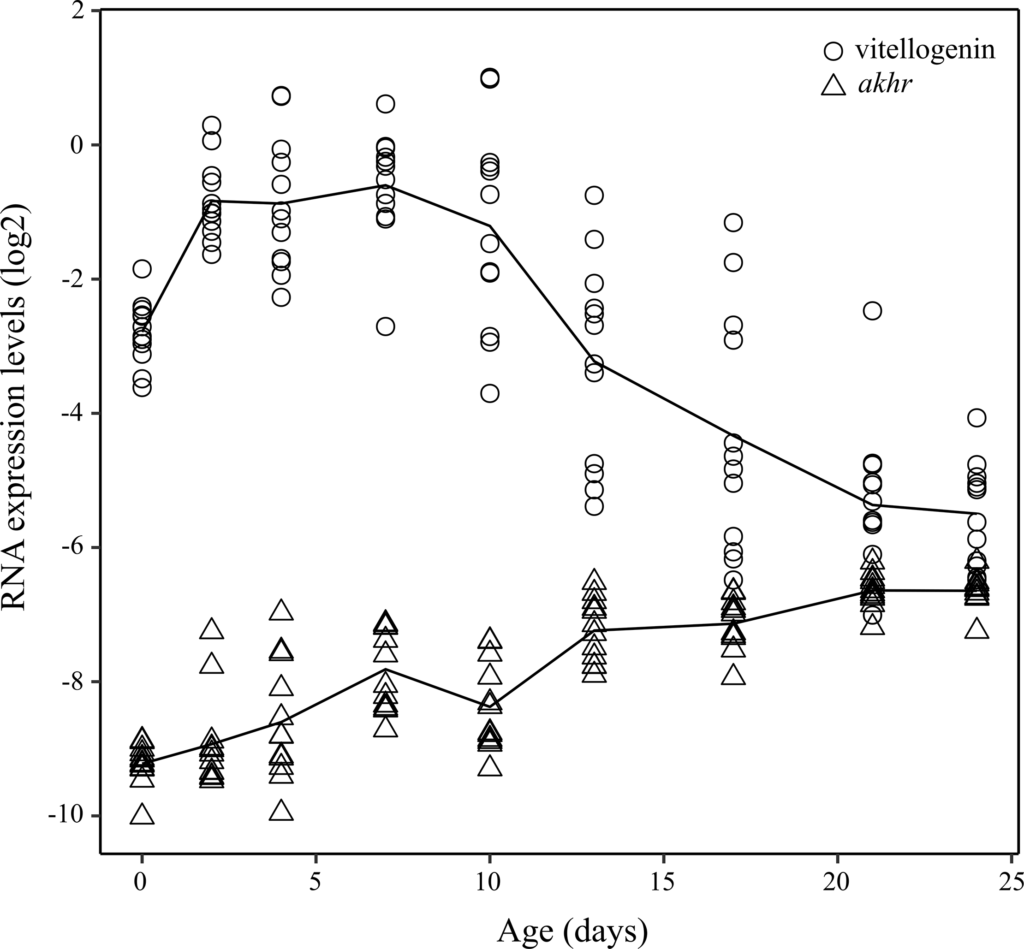
Figure 3. Expression levels of vg (circles) and akhr (triangles) as a function of bee age. The solid lines represents average.
Researchers also explored the influence of Varroa infestation levels on average biological age of bees in the apiary, indicative of lifespan of those bee populations . One apiary was treated with conventional miticide treatments (Apistan), the other apiary was treated using organic thymol treatments. In the conventionally treated apiary, the average age of the bee population decreased from 17 days during spring to 6 days before wintering. In the organically treated apiary, the average lifespan of the bee population increased from 13 days in spring to 18.5 days in August before decreasing back to 13 days before wintering (Figure 4).
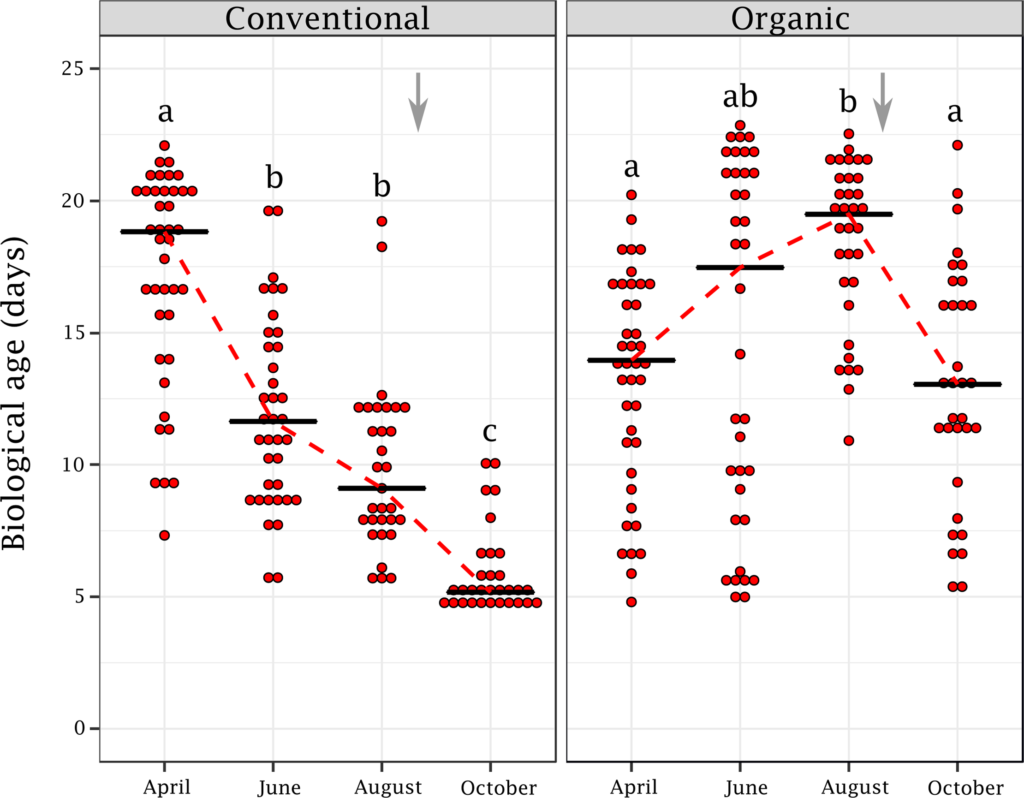
Figure 4. Biological age comparison in conventional and organically treated hives from spring to fall. Different letters indicate significant differences between months. The black line indicates the median biological age. Varroa treatment is indicated by grey arrow.
Other colony parameters assessed between the organic and conventional apiaries include: food reserves, brood production and hive population. In both apiaries, the level of open/closed brood cells was high at the beginning of the foraging season and then declined as fall approached. Pollen storage was stable in the conventional apiary but decreased significantly in the organic apiary after spring. Varroa infestation levels remained below 5% in the conventional apiary in comparison to the organic apiary which faced a severe increase in Varroa infestation levels until fall treatment. In the conventional apiary there was a positive correlation to biological age and the amount of brood cells and a negative correlation with honey stores and Varroa infestation levels. In the organic apiary, biological age was positively correlated with Varroa infestation levels and negatively correlated with pollen stores.
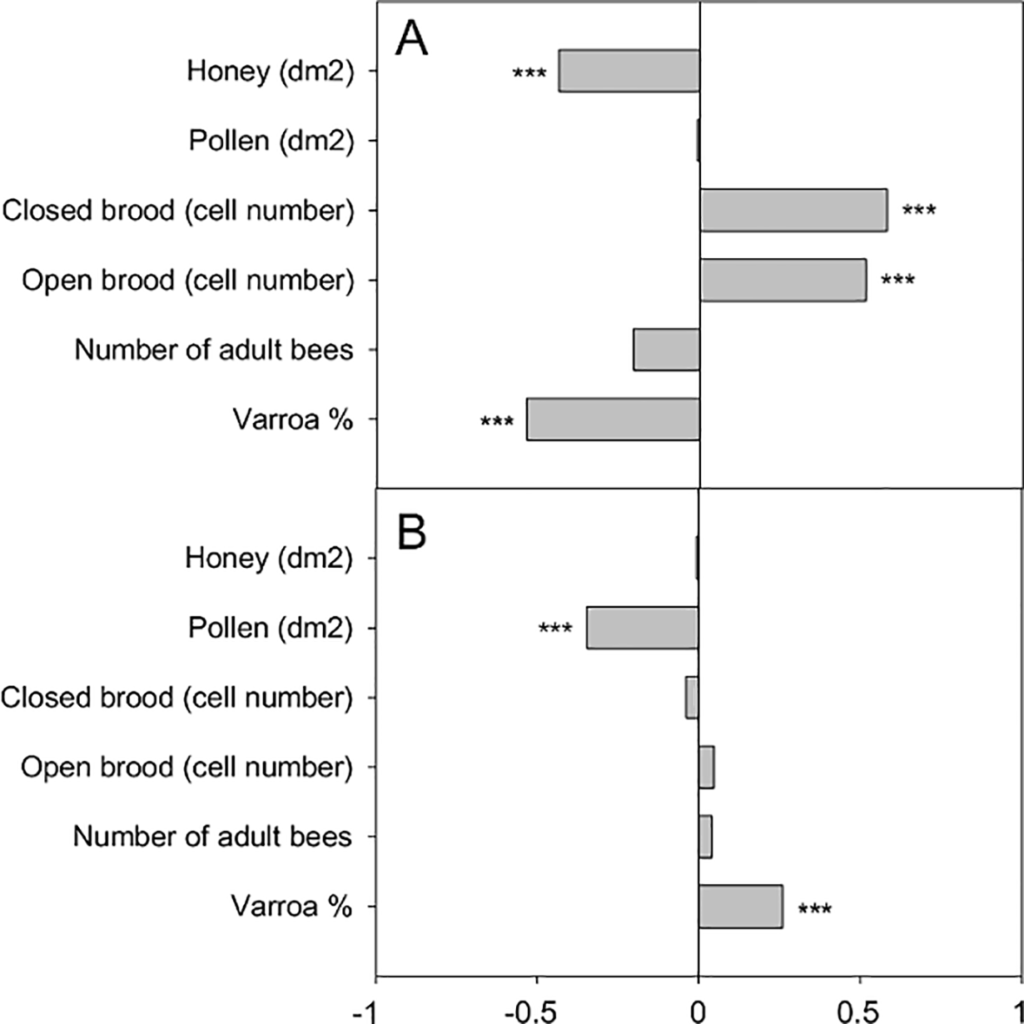
Figure 5. Correlation between biological age and colony parameters in conventional (A) and organic (B) apiaries.
*** denotes significant correlation (p<0.001).
This study confirms that biomarkers (vg, ahkr) can be used to measure how biological age is affected by colony disturbances as a result of environmental stress. It is common knowledge that varroa infestations, lack of brood and starvation are detrimental to hive health but further investigation is required to conclude the role these parameters play in biological age. Exploration into additional biomarkers and other causes of colony disturbance will improve predictions of biological age and colony health.
Is the Brood Pattern within a Honey Bee Colony a Reliable Indicator of Queen Quality?
In the past, honey bee queens could produce healthy brood patterns for years. Unfortunately, that is no longer the case as queens are being replaced multiple times a year to avoid colony loss. A recent publication by Lee et al. studied brood pattern as a factor contributing to the increase in queen failure and colony loss.
The brood pattern in 6 month old queen colonies was nominally ranked on a scale of 1-5, 1 being poor brood pattern and 5 being good brood pattern. A brood pattern with <80% sealed brood was considered poor. The researchers “partial reciprocal transplanted” queens, meaning they swapped the queens between poor and good sealed brood colonies and quantified the change after a full brood cycle. At that point, queen biometrics and sperm viability were recorded. Other colony observations include: adult bee population, presence of queen cells, pathogens, pests and pesticide residues.
Conclusions on queen quality could not be made based off sperm viability or presence of pathogens. Noticeable differences in brood pattern were observed after the partial reciprocal transplant. Queens from poor brood colonies significantly increased brood production by 12 more sealed cells after being exchanged into colonies with good patterns for an entire brood cycle. Queens from good brood colonies significantly decreased brood production by 8 less sealed cells after being exchanged into poor brood colonies. This suggests that the queen is not solely responsible for brood pattern quality. Pesticides, pathogens and poor nutrition are the more likely to influence the health of the brood pattern than the quality of the queen. Future studies will explore specific symptoms associated with queen failure to address issues in queen health.