
Temporal changes in the viromes of Swedish Varroa-resistant and Varroa-susceptible honeybee populations.
Varroa destructor mites vector honey bee diseases and contribute to increased annual colony loss. Thuduri et al. compared viral resistance in varroa mite susceptible (MS) honey bee populations with a naturally varroa mite resistant (MR) isolated honey bee population in Sweden.
The two honey bee populations (MR, MS) were managed in separate geographic locations. MS populations were managed for mites prior to the start of the study by drone removal in addition to formic and oxalic acid treatments. Thirty bees from each population (MR, n=14; MS, n=12) were isolated from the brood frames and sampled three times during the fall of 2009. All of the MS colonies died that winter. Eight of the MR colonies survived and were sampled again the following spring 2010.
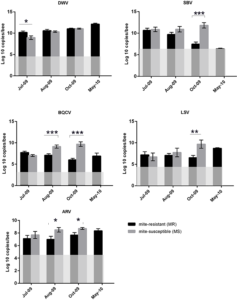
RNA sequencing was used to compare viral load in the honey bee populations (MR, MS) in addition to assessing additional factors that may contribute to mite resistance. Figure 1 elucidates statistically significant differences in viral loads among MR and MS colonies. MR colonies appear to be more resistant to Black Queen Cell Virus, Sacbrood Virus and Deformed Wing Virus than MS colonies (Figure 1). Viral load alone does not explain differences in colony survival between the two different populations (MR, MS). Natural variation between colonies makes it difficult to determine mechanisms that reduce viral load and increase colony survival in mite resistant populations. Future tests will focus on improved instrumentation and tests to determine the mechanisms and association between individual or colony level adaptations and viral load.
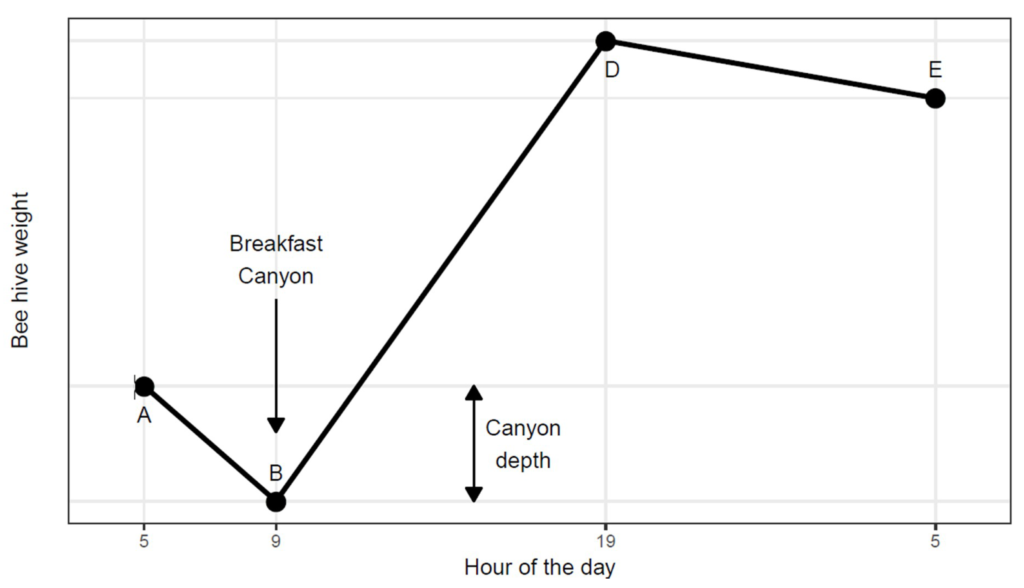
Breakfast Canyon Discovered in Honeybee Hive Weight Curves.
Holst and Meikle revamp a classic study on weight curves in honey bee colonies using algorithms and statistics to provide biological meaning to the numbers. Data sets obtained from previous experiments were used in their statistical analysis to provide insight into daily hive weight fluctuations. Results suggest that weight changes reflect several honey bee processes including: nectar inflow and evaporation, fluctuations in honey and pollen stores, base and heating respiration, worker mortality, precipitation, dew, and physical exchanges of humidity between the air and the beehive construction.
Impact of the microsporidian Nosema ceranae on the gut epithelium renewal of the honeybee, Apis mellifera.
Nosema ceranae infects the midgut of the honey bee causing the most common honey bee disorder, nosemosis. Panek et al. investigate the N. ceranae infection process and the host defense mechanisms honey bees are equipped with to tolerate and repair damage caused by the pathogen. Results from their study prove N. ceranae negatively alters renewal of the gut lining and disrupts pathways for gut homestasis.
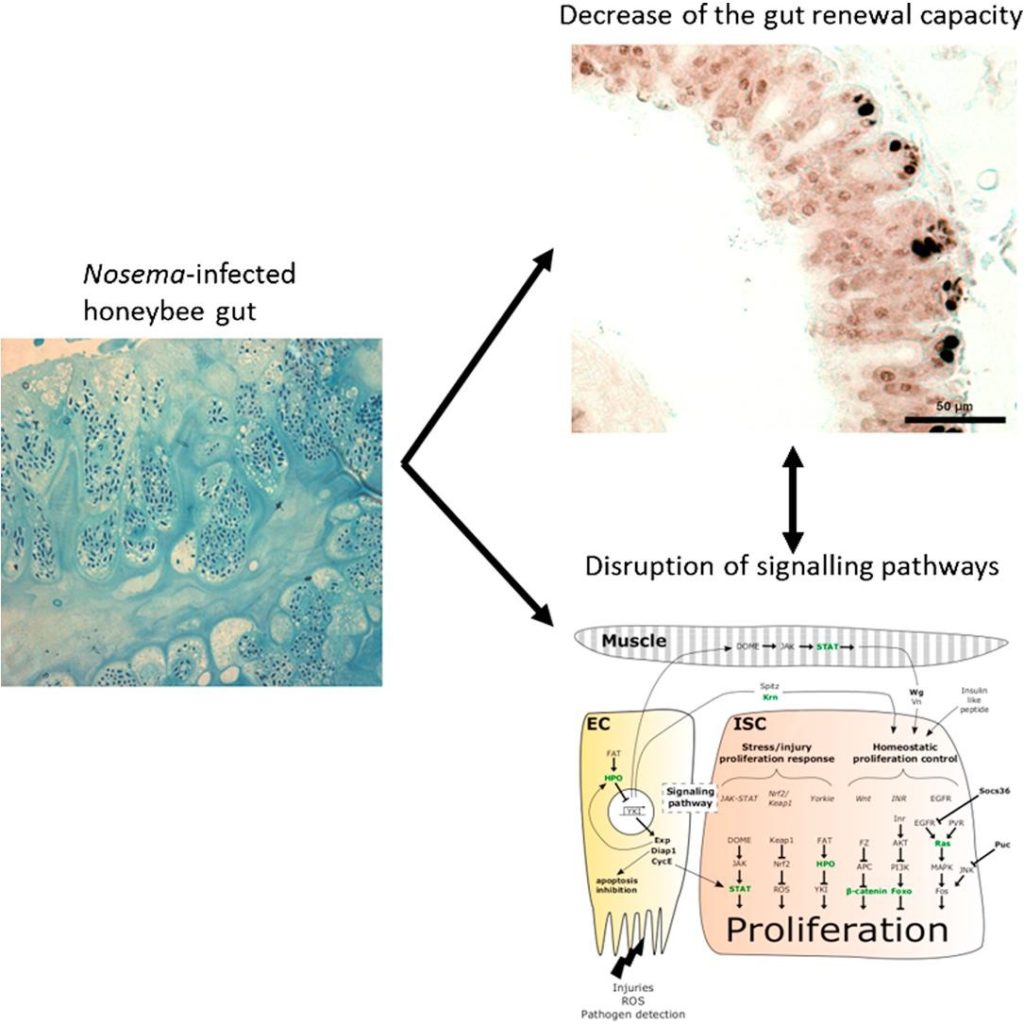
Figure 3. N. ceranae disturbs honeybee gut epithelium, disrupting signalling pathways and reducing lifespan.